Cartographic Skills
Activity: Become a Cartographer (Map Maker)
Supplies Needed:
- A Balloon
- Markers
- Paper Towels
- Letter-size Paper
- A Globe
- Scissors
Group Size: 2 Students
Activity: 1) blow-up the balloon as much as you can while it still keeps a rounded (spherical) shape. If it start to turn into an oval shape, let some of the air out. Tie it closed. 2) While observing a globe, try to accurately draw the Earth's landmasses on the balloon with a marker (BE CAREFUL: wet marker ink on a rubber balloon will easily smear and get on your clothes.) 3) After you have redrawn all of the landmasses of your balloon, careful cut a small hole in the balloon near the stem to release the air. (WARNING: if you 'pop' the balloon too quickly, it will blow it apart, and you will have to start over again.) Then make some decisions about where you would like to cut some lines in your balloon to cause it to lay flat. 4) While one person holds the balloon flat (NOTE: place paper towels on the desk to prevent ink from smearing), the other person tries to draw a map of the 'world' on a letter size piece of paper.
Discussion Questions:
- What did you learn about cartography (map making) through this process? Explain.
- What problems did you experience? Explain.
- Is your map completely accurate? Explain.
A Brief History of Maps and Cartography
The Guardian: Geography World Map
Unit Objectives and Final Product
The Learning Objective: By the end of this unit, students should have a solid understanding of the basic concepts and tools used by geographers. This unit is broken down into 2 sections:
The Final Project: At the end of first unit, you will be required to create a Thinking (Concept) Map (see some examples here) to demonstrated your understanding of the two sections in this first unit: Cartographic Skills and Geographic Skills.
As we progress through these series of exercises, you will need to take detailed notes, because you will need to display the information that you learned in this unit on your Thinking Map.
- Cartographic Skills: in this section, students will explore the process making maps. Students will examine some of the problems, and them explore some of the possible solutions to these issues.
- Geographic Skills: in this section, students will examine the basic concepts used while studying geography, such as the 5 Themes of Geography, map reading, and the different types of maps.
The Final Project: At the end of first unit, you will be required to create a Thinking (Concept) Map (see some examples here) to demonstrated your understanding of the two sections in this first unit: Cartographic Skills and Geographic Skills.
As we progress through these series of exercises, you will need to take detailed notes, because you will need to display the information that you learned in this unit on your Thinking Map.
Problems with Projections
If you have ever tried to make a deflated basketball lie flat on the ground, you will soon realize that it is impossible. If you push down one area, another area will come off the ground. You could try different strategies such as cutting the ball apart or stretching out the corners, but after awhile, it will no longer be recognizable as a basketball. These are the same decisions that cartographers face. Ultimately, it is impossible to make a 100% accurate map. Therefore, cartographers must make decisions about the following:
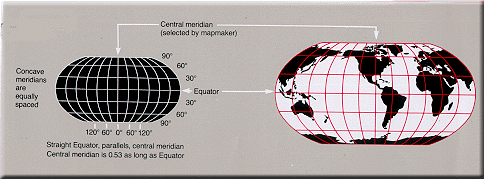
Cartography is the art and science of mapping making. It involves taking a portion Earth's surface ranging in scale from a small area to the entire planet's surface and transforming it from a 3-Dimensional object to a 2-Dimensional representation. Since large scale map making involves a process of transferring a spherically shaped object onto a flat surface, they are often referred to as projections. Here are some examples of the different processing methods used in making projections.
- Do I need the landmasses to stay as close to their real shape as possible?
- Do I need the landmasses to stay as as close to their real size as possible?
- Can I have breaks in the certain areas, or does it need to appear as connected?
Cartography is the art and science of mapping making. It involves taking a portion Earth's surface ranging in scale from a small area to the entire planet's surface and transforming it from a 3-Dimensional object to a 2-Dimensional representation. Since large scale map making involves a process of transferring a spherically shaped object onto a flat surface, they are often referred to as projections. Here are some examples of the different processing methods used in making projections.
Scene from The West Wing: social justice and maps.
|
|
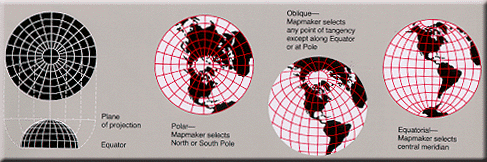
Image Source: United States Geological Survey (USGS)
Projections
Activity: create a Venn Diagram comparing and contrasting two sets of projections that are next to each other (for example, compare and contrast the Mercator and Miller Projections). Observe items such as their use of latitude and longitude lines, areas of greatest and least distortion, how these projections may be used.
Compare Map Projections
Projection Transitions
Map Projection Transitions
The True Size Of. . .
Tissot's indicatrix
Tissot: Mercator Distortion
Compare Map Projections
Projection Transitions
Map Projection Transitions
The True Size Of. . .
Tissot's indicatrix
Tissot: Mercator Distortion
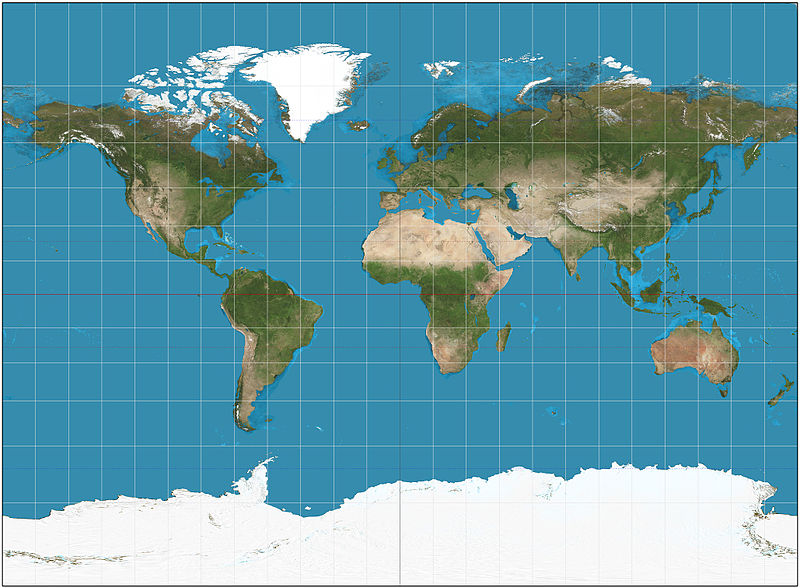
Projections that attempt to represent correct shapes of landmasses but distort the sizes.
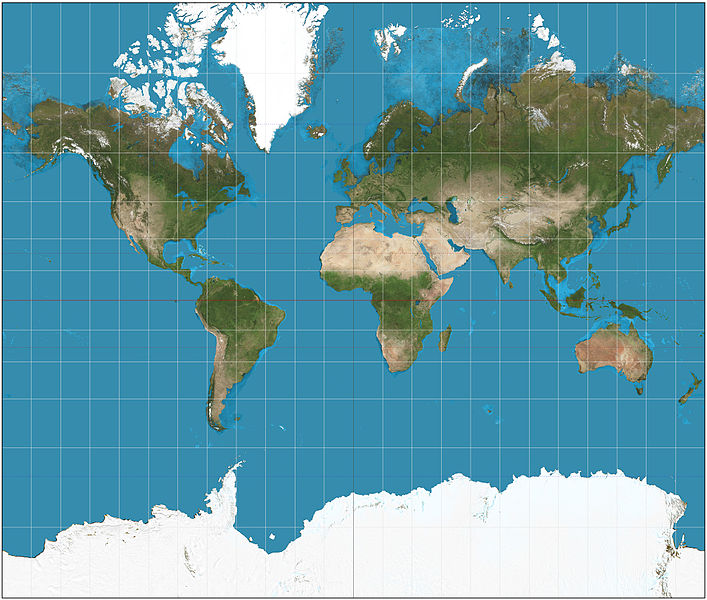
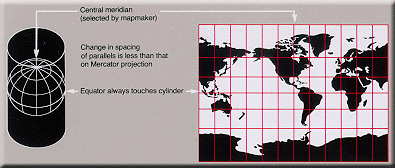
Mercator Projection
|
Miller Projection
|
Equal-Area Projections that attempt to represent correct sizes of landmasses but distort the shapes.

Lambert Cylindrical Equal Area Projection
|
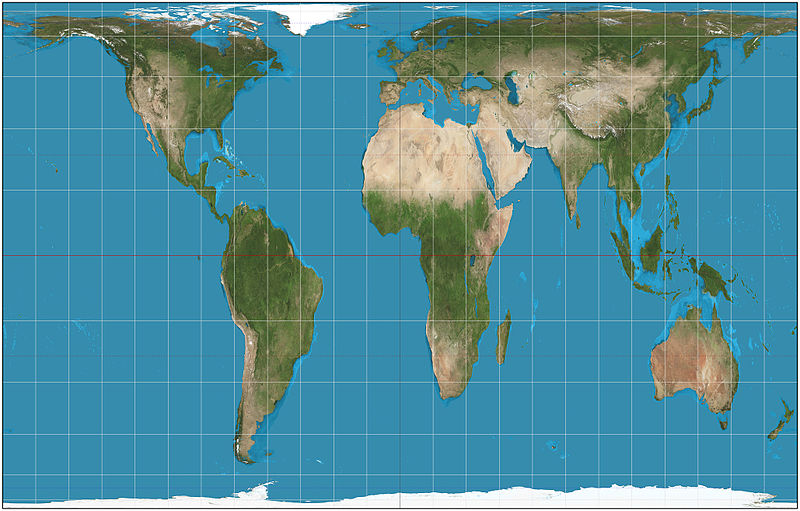
Gall-Peters Projections
|
Projections that attempt to maintain correct sizes and shapes through gaps.
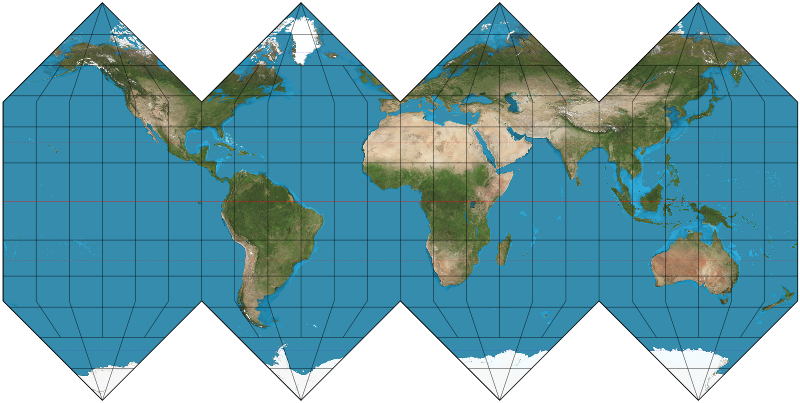
HEAL Pix Projections
|
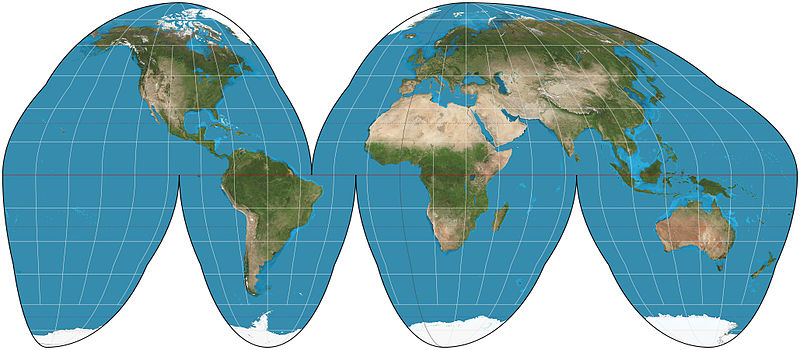
Goode Homolosine Projection
|
Projections that round the edges to mimic a spherical shape.
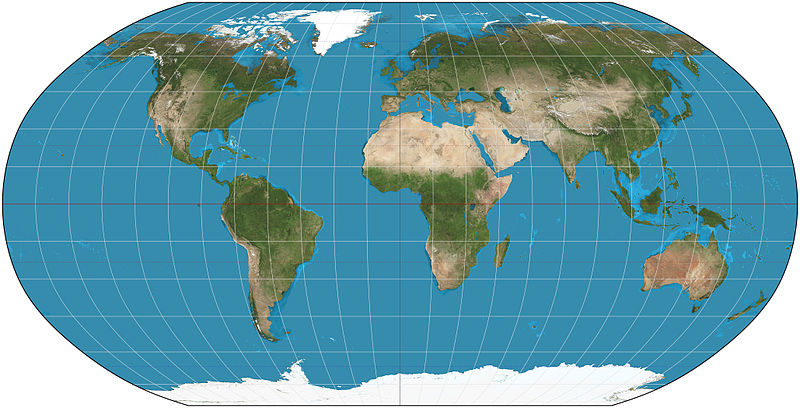
Robinson Projection
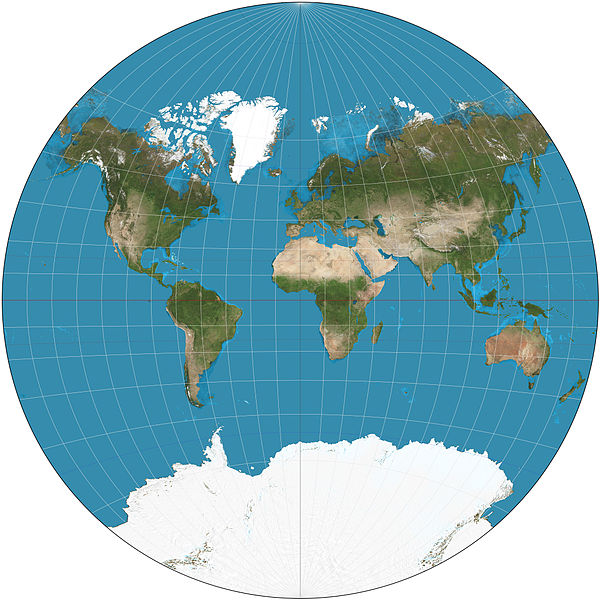
Van der Grinten Projection
|
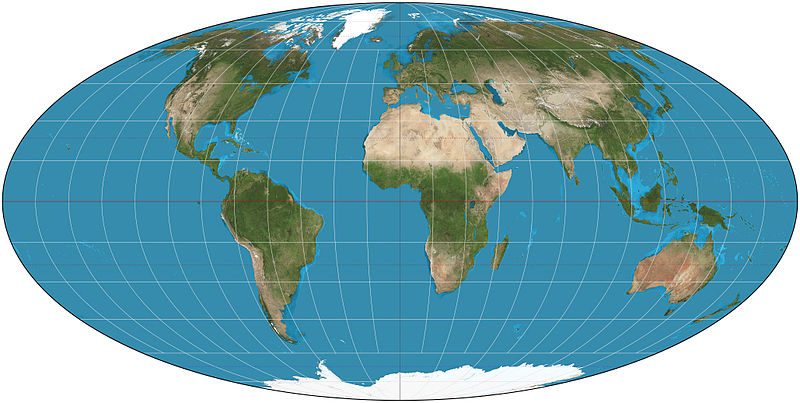
Mollwide Projection
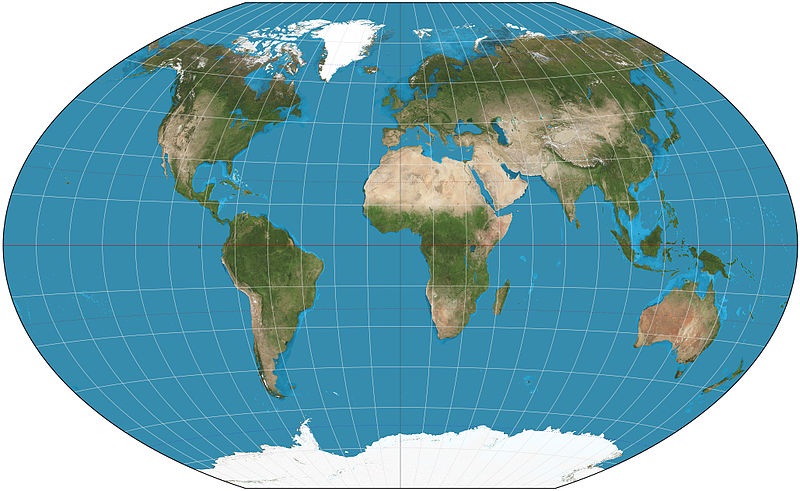
Winkel Triple Projection
|
Azmithal Projections from a North Pole Perspective
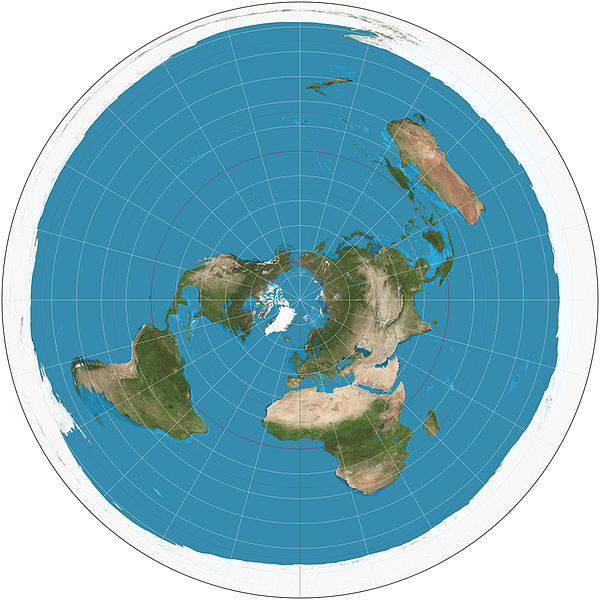
Azimuthal Equidistant Projection
|
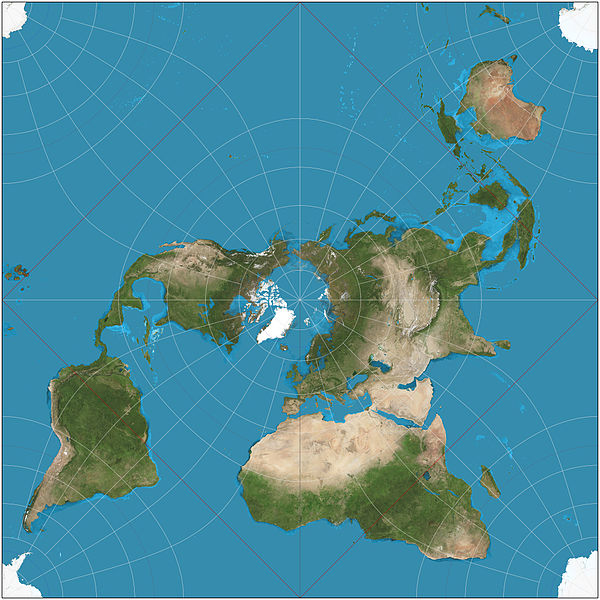
Peirce Quincuncial Projection
|
Projections Source: Wikipedia (Creative Commons Licence.
Cartography over Time
The following video on map making was created in the 1940's. Investigate 3 new technologies that are used in modern map making.
